Gold Stock Buy Signal
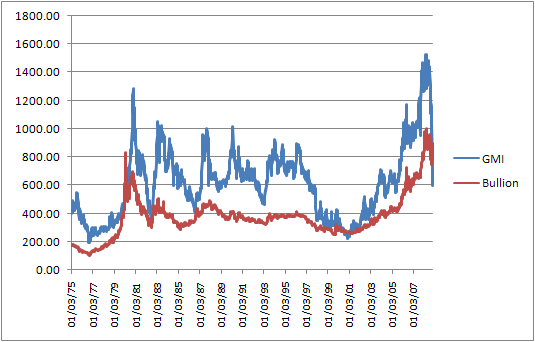
One reliable indicator that I have followed over the years to time the purchase of gold stocks is the K-Ratio. At the present time, the K-Ratio is giving a strongly bullish signal. The K-Ratio is computed by dividing the value of Barron’s Gold Mining Index (GMI) by the Handy & Harmon gold price. Using data from the latest issue of Barron’s, the K-Ratio is now at .90 and flashing a very strong buy signal.
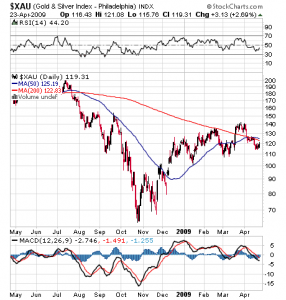
The last extremely bullish reading was registered in late October of last year when the K-Ratio recorded an all time low reading. Since last October gold mining stocks have advanced strongly with the XAU recording a 100% gain from the October bottom to its recent high of 140.
K-Ratio Forecasting Major Up Move for Gold Stocks
The K-Ratio works best at extreme readings when the GMI is below the price of gold, which is the case now. The old rule of thumb is that an extreme bullish reading occurs when the K-Ratio is at 1.20 or lower indicating that gold stocks are cheap compared to the price of gold bullion. In the past, a sub 1.20 K-Ratio has triggered gold stock advances of over 50% and bullion advances of over 25% within 6 months.
 Courtesy: Kaeppel’s Corner
Some major gold producers that usually perform well in a rising gold market are KGC, GG and GOLD. I would look for all of these issues to show major gains in line with the performance of the XAU over the next six months.
Gold, Silver – An Important Alert!
The Gold Direction Indicator is flashing another buy signal. This indicates that the pull-back that started late February is probably finished. A new rally is about to start.
Disclosure
Long GG, GOLD, KGC

Bill,what kind of long term performance does the K-ratio have?I looked for additional info online,and their were only a couple of references.No recent comments on this indicator.Surely it must be one of several you look at?There are so many forces at work…how can you be so sure it will work”this time”?
The Gold Direction Indicator indicates that the pull-back that started in february is probably finished. A new rally may start.
The best way to see the correlation is to look at the chart which plots the Barron’s GMI against the price of bullion. When the GMI is below the price of bullion, gold stock prices (as represented by the GMI) usually do quite well. No sure things in life but I like the weight of the evidence using this indicator.