December 13, 2024

Time Tested Indicator Predicts Huge Gains For Gold Stocks

K-Ratio Flashing Major Buy Signal

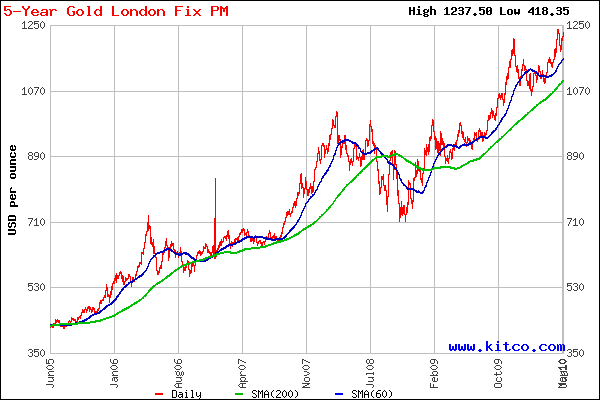
The increase in gold prices over the last five years has outperformed virtually every other asset class.   From the low $400 range in 2005, gold has soared almost 300% to over $1200 per ounce.

5 Year Gold - Courtesy Kitco.com

5 Year Gold - Courtesy Kitco.com

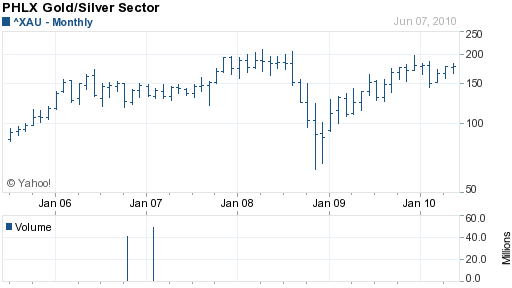
Although many gold stocks have seen substantial gains since 2005, the overall price gains of gold stocks has underperformed the price appreciation of the metal as can be seen by viewing the PHLX Gold&Silver Index, comprised of 16 major gold and silver producers.  While the price of gold has appreciated almost 200%, the XAU has lagged considerably with a gain of 96%.

XAU GOLD&SILVER INDEX -COURTESY YAHOO.COM

XAU GOLD&SILVER INDEX -COURTESY YAHOO.COM

While the reasons for the price disconnect between gold and individual gold stocks are in many cases company specific, the question on most investors minds is where do we go from here?  Will the large increase in gold prices eventually translate into major gains for the gold producing stocks?   The emphatic prediction, according to the K-Ratio, a time tested method for timing the purchase of gold stocks, is telling us to stay long and accumulate gold stocks.

The K-Ratio is computed by dividing the value of Barron’s Gold Mining Index (GMI) by the Handy and Harmon price of gold.  The index reflects the relative value of the price of gold stocks to the price of the underlying metal.  When the ratio of the price of gold stocks to the price of gold is low, it is a bullish signal.  Conversely, if the price ratio of the gold stocks relative to the metal is excessive, it is usually a good signal to sell the gold stocks.

The K-Ratio works best at extremes.  The rule of thumb based on past history tells us that a K-Ratio at 1.20 or lower indicates that gold is cheap compared to the price of bullion.  A K-Ratio reading of 1.90 or higher is extremely bearish and indicates extreme overvaluation of the gold stocks.

The latest weekly reading on the K-Ratio shows a very bullish reading of .96 (Barron’s Gold Mining Index of 1158.99 divided by the Handy and Harmon Gold Price of $1203.50).   Since 1975, readings at or below 1.15 on the K-Ratio have resulted in gold stock gains 90% of the time over the next 12 months with an average gain of 40%. Lending anecdotal support to a large rally in the gold stocks is the overwhelming number of bearish articles on gold by the mainstream press.   From a fundamental perspective, of course, it does not hurt that logical minds are beginning to question the value of paper currencies of numerous sovereign nations.

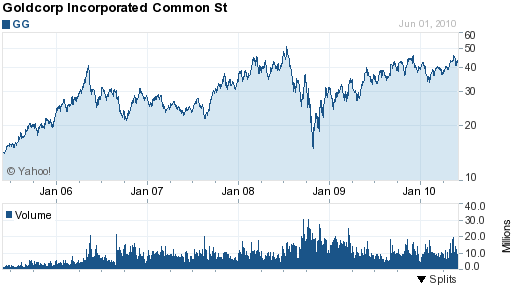
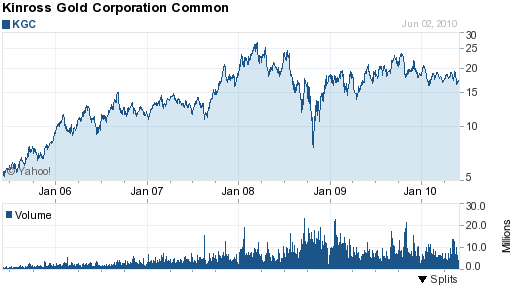
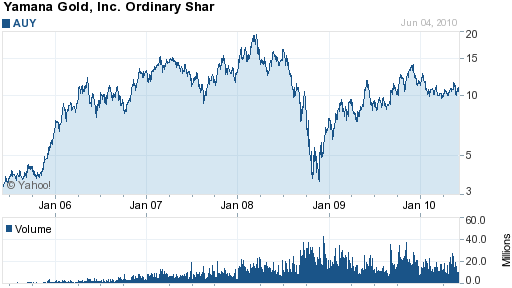
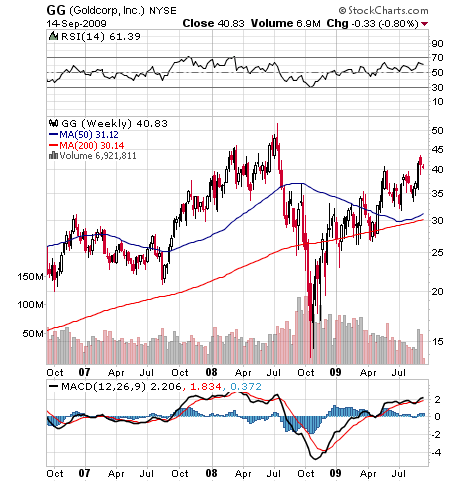
Accumulation of high quality gold stocks such as NEM, GOLD, GG, KGC and AUY seems warranted, especially on price pullbacks.  Based on the technical and fundamental factors, the bull market in gold stocks has a long way to run.

Courtesy yahoo.com

Courtesy yahoo.com

Courtesy: yahoo.com

Courtesy: yahoo.com

Courtesy: yahoo.com

Courtesy: yahoo.com

Courtesy: yahoo.com

Courtesy: yahoo.com

Courtesy: yahoo.com

Courtesy: yahoo.com

Disclosures: Long NEM, GOLD, GG, KGC, AUY
K-Ratio Indicates Gold Stocks Still Cheap

K-Ratio Predicts Higher Gold Stock Prices

Based on the recent large rally in the gold stocks, it is time to sell and take profits?  The K-Ratio, a time tested method for timing the purchase and sale of gold stocks is telling us to stay long gold.

The K-Ratio is computed by dividing the value of Barron’s Gold Mining Index (GMI) by the Handy and Harmon price of gold.  The index reflects the relative value of the price of gold stocks to the price of the underlying metal.  When the ratio of the price of gold stocks to the price of gold is low, it is a bullish signal.  Conversely, if the price ratio of the gold stocks relative to the metal is excessive, it is usually a good signal to sell the gold stocks.

The K-Ratio works best at extremes.  The rule of thumb based on past history tells us that a K-Ratio at 1.20 or lower indicates that gold is cheap compared to the price of bullion.  A K-Ratio reading of 1.90 or higher is extremely bearish and indicates extreme overvaluation of the gold stocks.

Bullish On Gold Stocks

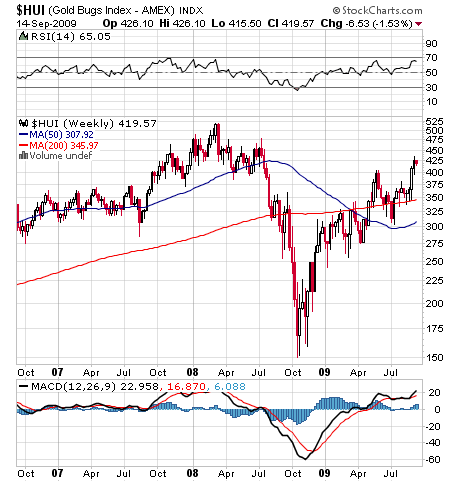
When last reviewed on April 24, 2009, the K-Ratio was at .90 and flashing a major buy signal.  Since that time, the Gold Bugs Index (^HUI)  has advanced by 39%.  What should be of extreme interest to gold stock investors at this point is that, despite the large gains in the gold stocks, the K-Ratio has increased only modestly and presently stands at 1.15,  still in solidly bullish territory.  (K-Ratio = Barron’s Gold Mining Index of 1159.20 divided by the Handy & Harmon Gold Price of $1008.25).

Since 1975, readings at or below 1.15 on the K-Ratio have resulted in gold stock gains 90% of the time over the next 12 months with the average gain a very profitable 40%.

There are no absolutes in investing and gold stocks are likely to fluctuate, but based on the time tested K-Ratio, it is way too early to be taking profits in the gold stocks.

hui

xau

gg1

kgc

gold

Disclosures: Long GOLD, KGC, GG

UPDATE:  FEBRUARY 14, 2010
The K-Ratio is still flashing bullish at 1.03.   As is typical when the bullion price retreats, the gold stocks react in a more volatile manner,  resulting in greater price declines in the gold stocks than in the price of the bullion.   From the recent high in late 2009, the price of gold bullion has retreated by 11%, while the price of major gold stocks such as Goldcorp (GG) and Randgold (GOLD) are down by 20%.   Accumulation of gold shares still seems warranted based on technical and fundamental factors.