January 5, 2025

Google Chromecast Is 2013’s Smash Hit Electronic Wonder


Google has done it again with the release of the Google Chromecast streaming media player.

It wasn’t enough that Google (GOOG) developed and offered for free the Android operating system.  As an open source OS, Android quickly became the world’s most widely used smartphone platform.  Due to its low cost and flexibility, Android is also becoming the software of choice for a wide range of other electronic devices including televisions, video games and digital cameras.   

Google has quietly been coming out with a string of ingenious devices which will bring fundamental changes to the economy and revolutionize the way we live.  Who would have thought that Google would make a self-driving car a reality so quickly or allow us to merge our lives with the internet with Google Glass?

Although the Chromecast  HDMI streaming media player does not seem like that big of a deal compared to other ingenious Google products, it threatens to fundamentally change the multi-billion dollar cable industry, perhaps in the same dramatic fashion that Apple’s IPod changed the music industry.  As media inexorably moves to the internet, who needs the expensive and clunky cable companies with their hideous black cords running all over the house when you can wirelessly connect your TV to the internet with Chromecast?  High monthly cable bills could become a thing of the past.

For only $35 dollars and two minutes of installation time, Chromecast  uses your smartphone, laptop or tablet to stream pretty much anything  you want from the internet to your TV.  As word of Chromecast spreads, it has quickly sold out at major retailers such as Best Buy and Amazon. 

If you use Netflix (NFLX) or want to sign up for Netflix the Chromecast is essentially a free giveaway to consumers since existing or new Netflix customers will receive three months of free service which is worth about $35.

Google is quietly establishing itself as one of the most innovative companies in the world.  It’s hammer lock on internet searches provides billions of dollars in profits that are being used to develop new products and technologies which in turn provide Google with massive amounts of information on consumer preferences and buying habits.  The massive data bases gathered on consumers using Google products in turn allows Google to charge advertisers higher ad prices through focused marketing and the profitable circle is completed.  If anyone is looking for the first trillion dollar market cap stock, Google is a prime candidate.
Jones Soda – Back from the Dead

About a decade ago, Jones Soda (JSDA) was briefly an incredible success story about a regionally popular brand which had used grassroots marketing to achieve rapid growth on a national scale. Unfortunately, the soda story fizzled when they tried to expand into national chains like Target (TGT) and Walmart (WMT) using aluminum cans rather than their iconic glass bottles.  In addition, Jones Soda began their expansion efforts precisely at a time when the popularity of carbonated beverages began to decline.

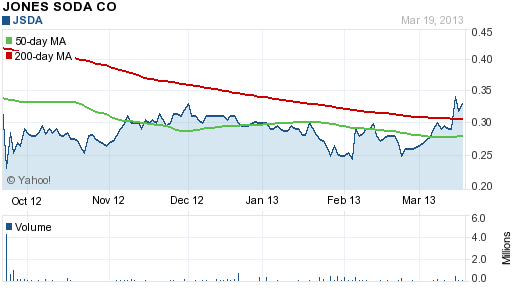
A combination of missteps and bad timing brought the company to the brink of bankruptcy, driving its once promising stock from a peak of more than $28 to less than $1. The price fell further to about 25 cents after the shares were delisted from the NASDAQ exchange.  Since early March Jones Soda has been moving steadily higher and recently had a higher volume spike that propelled the stock price above both the 6 month price range and the 50 and 200 day moving average.

courtesy: yahoo finance


Courtesy: yahoo finance

Things may finally be looking brighter for Jones Soda with new CEO Jennifer Cue at the helm. Since her appointment on June 30, 2012, she has implemented a back to basics turnaround strategy which has allowed the company to stabilize before pursuing a path of responsible and hopefully profitable growth.

The strategy involved rapidly trimming expenses and slightly retrenching to the company’s core markets and independent distributors. In the latest quarter, operating expenses were cut to $1.1 million compared to $2.7 million last year. Some of the cuts did have an impact on revenue which fell to $3.1 million from $3.4 million in the prior year. Despite the drop in revenue, gross profit was up slightly, showing the positive impact of the realignment of costs.

The loss from operations for the most recent quarter was $448,000, a vast improvement from the loss of $2.0 million last year. Most significantly, the company was cash flow positive for the quarter with $247,000 generated from operations. In the previous three quarters, Jones Soda had negative cash flow from operations of $6.5 million, and they were at risk of running out of capital. Now the company believes they have sufficient working capital to carry out their operating plan for 2013.  In addition to $4.1 million of working capital, Jones Soda has a $2 million credit facility.

Corporate insiders have confirmed their conviction of a brighter future for Jones Soda through a series of stock purchases.  CEO Jennifer Cue bought 50,000 shares at $0.30 from December 7 to 10, 2012.  Carrie Traner, VP of Finance bought 10,000 shares at $0.29 to $0.34 on March 14 – 15, 2013 and Director Mills A Brown bought (indirectly) 81,350 shares at $0.2975 to $.033 on March 15, 2013.

Now that the company has brought expenses under control, they are investing in distribution and product lines that will drive long term profitable growth. After laying off nearly half of their staff in the second half of 2012, they recently hired four new employees for their sales staff. The sales staff is now paid on a variable compensation structure, which should help to keep costs aligned with revenue.

The company has just introduced Jones Natural, which will soon launch in California. The new beverage has 30 calories and will come in four different flavors. It will be offered in 50 Albertson’s grocery stores in the natural foods section. The new beverage will also be offered in 25 Whole Foods Market (WFM) stores in Northern California. Significantly, this is the first time that a Jones Soda product has been carried by Whole Foods.

The groundwork has now been laid for a possible return to growth and profitability for a company once left for dead. The current market cap of merely $13 million hardly reflects the progress that has been made in the last two quarters.  While the stock remains extremely speculative, it is certainly one worth watching in the coming months.

Disclosure: Long JSDA

SELL EVERYTHING NOW! – How To Avoid Idiots Masquerading As Financial Experts

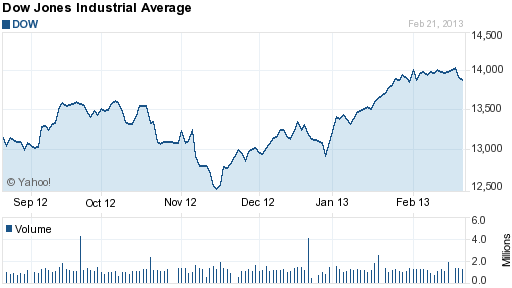
From mid November 2012 to February 19th, 2013, the Dow Jones Industrial average gained 1,400 points for a gain of almost 12%.  On February 20 and 21, the Dow Jones swooned a quick 200 points, a loss of less that 2%.  Such a minor pullback after a robust multi month rally is not what I would consider to be a shocking or unexpected event.

Nonetheless, innumerable articles predicting financial Armageddon have appeared in the mainstream financial press following the market’s minor correction.  Has the world really changed all that much after a 200 point Dow loss or is there something fundamentally flawed with the manner in which the financial press presents information to its readers?

News organizations have the right to publish whatever they chose to.  The question that needs to be asked by the investing public is whose interests are best being served.  Do sensationalistic headlines really translate into useful information for readers or is the mainstream press primarily serving its own financial interests by publishing hyped up “news” to boost advertising revenue?  Caveat emptor – financial readers need to identify and ignore trash journalism.

Here’s the example of the week on the type of “trash reporting” that investors need to ignore.  So called “market guru” Dennis Gartman tells his subscribers that he is selling and “rushing to the sidelines.”  CNBC regularly interviews Gartman who always comes up with wonderful soundbites that help CNBC (whose ratings have plunged).  Gartman also benefits by plugging his market newsletter.  No problem so far, but does the declining audience of CNBC benefit, most of whom presumably tune in for intelligent investment advice?

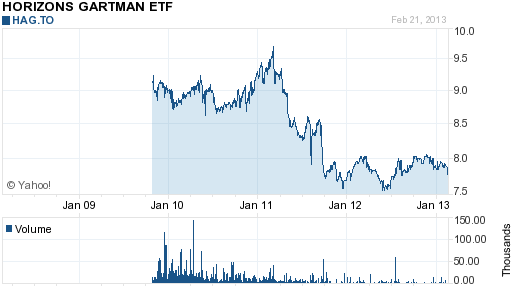
In Gartman’s case, it’s easy to determine the value of his investment prowess since Mr. Gartman runs his own little alternative investment fund known as Horizons Gartman ETF Comm (HAG.TO).  According to Yahoo, “The fund’s objective is to provide investors with the opportunity for capital appreciation through exposure to the investment strategies of The Gartman Letter, L.C., founded by Dennis Gartman.”  So how has that worked out?

The horrendous return on this fund becomes even more disconcerting when considering that the overall market is up around 100% since Mr. Gartman started the fund in late 2009, shortly after the bottom of the last bear market.  When CNBC features Mr. Gartman as an investment expert without noting his abysmal investment track record, they are engaging in the worst form of deception.  If CNBC ever wants to be taken seriously and increase its viewership level, they should start by removing idiots like Gartman from their interview list.

Barron’s Super Bullish Cover Story – Don’t Waste Your Time Worrying About It

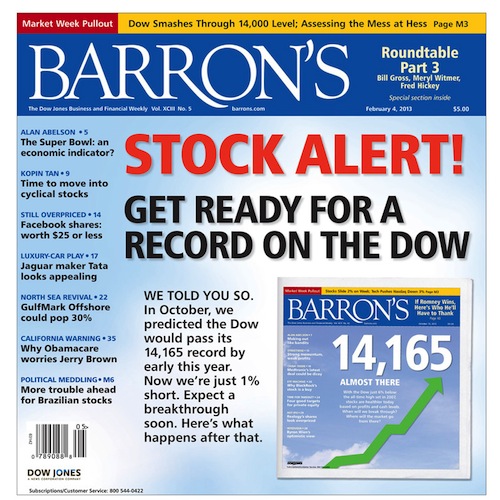
Barron’s super bullish cover story this weekend raised some eyebrows in the investment world.  According to popular legend, mass market magazines in the past have had a tendency to feature investment areas right at their peaks.  The alleged power of cover stories to signal tops in markets has even resulted in the “magazine cover indicator.”

Perhaps the most famous example of the “magazine cover indicator” was Business Week’s “Death of Equities” cover story in 1979 just prior to the beginning of the biggest and longest bull market in history.  The theory is that by the time a trend makes it to the front pages, the smart money has already gotten in and there is little to be gained by following the herd at that point.  Life is not that simple, however, and the “magazine cover indicator” doesn’t always work.  After making a really bad call on stocks in 1979, Business Week warned investors in January 2008 that the worst was yet to come for housing with the cover story “Meltdown – For Housing the Worst Is Yet To Come.”

So what is an investor supposed to think of Barron’s super bullish cover story on stocks?

Josh Brown of the Reformed Broker notes that Barron’s has frequently been right with it’s cover stories and that knee jerk reactions by websites trying to hype the story to increase clicks wind up doing their readers more harm than good.  Hard to argue with Brown’s common sense and balanced advice:

Welcome to the stock market circa 2013, where everyone is a contrarian mastermind and every piece of optimism is an automatic sell signal.

Everyone’s soooo clever with their magazine cover indicators. They saw the Barron’s cover from this Saturday and couldn’t wait to mock it, it’s almost like a reflex at this point. Anyway, here’s the “Kiss of Death” everyone’s carrying on about this weekend:

So here’s the deal, maybe this is the market top. Maybe we don’t quite make that new high above 14,165 on the Dow or worse – maybe we hit it and then crater. Who knows?

But I do know this…if it falls apart, it will have nothing to do with a Barron’s cover. After all, how would you have liked being short any of the below?

How about fading that 9/3/2012 cover below with the Bull bouncing a cannonball off his chest, everyone thought that one was laughably bullish…what are we up, 20% plus from there? More?

Or what about the now-infamous “Bye Bye Bear” cover from November 2010, how’d the other side of that trade work out for you?

Or what about the Buy Goldman cover from last October? That was  hilarious too, hope you didn’t automatically bet against it!

Or how about the “Time To Buy” Banks cover from the end of 2011? Seemed ridiculous with BofA and Morgan Stanley moments from succumbing to mortgage litigation and Euro exposure. God help you if you shorted that cover, most of the large cap banks mentioned went on to double over the next year while the sector itself went on to beat every other in the S&P with a 27% gain. They’d be scraping your too-clever ass off the sidewalk right about now.

At the other extreme, we get the hysterical conclusion from Global Economic Analysis that Barron’s has managed to mark the exact top of the bull market.  After some snarky commentary on Barron’s “faulty” use of the term money flow in explaining how investors are moving from bonds to stocks, the conclusion is made that it’s time to ditch stocks.

Third let me ask “Does it get any more extreme than someone calling this the first inning after stocks have had more than a 100% rally in a few years?

Supposedly we are only in “the first inning” of a rally. Hmm. Are stocks supposed to rise 900% more? This may not be “the top” but it’s close enough for me. I’m calling it.

So there you have it – this is a market top or maybe it’s not a market top.  The only conclusion one should draw from this is that anyone making investment decisions based on magazine covers should not be investing and deserves to lose money.  Instead of worrying about magazine covers, a sophisticated long term investor would be much better off reading the annual letter to shareholders from Warren Buffett.

Gas Prices Near Record High As U.S. Oil Production Surges – Paradox or Price Gouging?

Economics 101 tells us there is an inevitable correlation between supply and demand in a free market.  Overproduction of goods relative to demand invariably leads to lower prices.  This seemingly iron clad theory is currently being tested as retail gasoline prices approach all time highs even as U.S. Oil Production Rise Is Fastest Ever.

U.S. oil production grew more in 2012 than in any year in the history of the domestic industry, which began in 1859, and is set to surge even more in 2013.

Daily crude output averaged 6.4 million barrels a day last year, up a record 779,000 barrels a day from 2011 and hitting a 15-year high, according to the American Petroleum Institute, a trade group.

It is the biggest annual jump in production since Edwin Drake drilled the first commercial oil well in Titusville, Pa., two years before the Civil War began.

The U.S. Energy Information Administration predicts 2013 will be an even bigger year, with average daily production expected to jump by 900,000 barrels a day.

The surge comes thanks to a relatively recent combination of technologies—horizontal drilling and hydraulic fracturing, or fracking, which involves pumping water, chemicals and sand at high pressures to break apart underground rock formations.

Despite the huge increase in oil and gas production, the retail price of gasoline is near all time highs.

Courtesy: ritholtz.com

If demand for oil and gasoline was also rapidly increasing, current high prices would make sense from a demand and supply standpoint, yet this is not the case.

According to the American Petroleum Institute, the demand for oil fell to an astonishing 16 year low in the U.S. during 2012, yet gasoline prices are closing in on all time highs.  The drop off in demand for gasoline in the U.S. has been of historic proportions.  Gas consumption fell off a cliff when the economy crashed in 2008 and continued economic weakness has driven gas demand to all time lows.  Unemployed and underemployed people don’t drive much and the shock of a 100% increase in gas prices since 2009 has far outpaced the growth in paychecks, forced many consumers to take fewer trips by car.

courtesy: www.theburningplatform.com

Surging oil and gas production in the U.S. combined with much lower demand has resulted in energy companies exporting surplus oil and gas. Exxon Mobil (XOM), the second largest market cap stock in the world, predicts that the U.S. could actually become a net oil exporter by 2025.

The reason why increased oil and gas production has failed to bring down prices, despite an historic decline in demand, is twofold.

  1. Oil prices are determined by the global market and world demand for oil continues to grow.
  2. Virtually all of the increased oil production in the U.S. is based on horizontal drilling and fracking technology which significantly increases the cost of production to around $80 per barrel.

Although it is better to have oil and gas at a high price instead of no oil at any price, it is disconcerting to contemplate how much oil and gas prices could spike from higher demand if the world economy ever comes out of its long slump.

Disclosure: Long position in XOM

The Zero Sum Game Of Lower Interest Rates And Why Mortgage Rates Will Rise

The Federal Reserve has forced long term interest rates to historic lows in a desperate attempt to “stimulate” both the housing market and the economy in general.  The results have been mixed but the benefits of lower rates to borrowers are undeniable.  Lower rates reduce the cost of large debt burdens carried by many Americans and increases the spending power of those able to refinance.

Exactly how much lower the Fed intends to repress mortgage rates is anyone’s guess but as interest continue to decline, the overall benefits diminish.  Here’s three reasons why the Fed may wind up discovering that the economic benefits of further rate cuts will be muted at best, self defeating at worst.

1.  Lower rates are becoming a zero sum game for the economy as lower rates for borrowers translates into lower income for savers.  Every loan is also an asset of someone else and lower interest rates have merely been a mechanism for transferring wealth from savers to debtors.  Every retiree who prudently saved with the expectation of receiving interest income on their savings have been brutalized by the Fed’s financial repression. Even more infuriating to some savers is the fact that many debtors who took on irresponsible amounts of debt are now actually profiting from various government programs (see Foreclosure Settlement Q&A – A Victory For The Irresponsible).

A significant number of retirees that I know have been forced to drastically curtail their spending in order to make ends meet while others have been forced to draw down their savings.  The increased spending power of borrowers has been negated by the reduced spending power of savers.  This fact seems to elude Professor Bernanke who hasn’t been able to figure out why lower rates have not ignited the economy.

2.  Many consumer who would like to incur more debt are often turned down by the banks since their debt levels are already too high.  Those who can borrow often times chose to deleverage instead, considering the fragile state of the economy.  Anyone saving for a future financial goal (college tuition, home down payment, retirement, etc) is forced to reduce consumption and increase savings due to  near zero interest rates.  The Federal Reserve has destroyed Americans most powerful wealth building technique – the power of compound interest.  A 5% yield on savings will double your money in about 14.4 years while a 1% yield will double your money in 72 years – and that’s before taxes and inflation.

3.  As mortgage rates decline into uncharted territory, the mathematical benefit of lower rates diminishes.  As can be seen in the chart below the absolute dollar amount of monthly savings as well as the percentage decrease in the monthly payment diminish as rates race to zero.

Benefits of a refinance on a $200,000 mortgage diminish as rates decline

% Rate Mo Payment Mo Savings % Reduction Yearly Savings
6.00% $1,199.00
3.00%    $843.00 $356.00 29.70% $4,272.00
1.50%    $690.00 $153.00 18.10% $1,836.00
0.75%    $621.00  $69.00 10.00%    $828.00

Closing costs at lower rates also become problematic, making it impossible to recapture fees within a reasonable period of time.  With closing costs of $8,000 on a $200,000 mortgage refinance, it would take a decade to recoup closing costs.

Many astute analysts have made elaborate and compelling arguments that interest rates can only go lower.  From a contrary point of view, I believe that a future rise in interest rates is a high probability event.  This is the opposite of my prediction in March 2009 when I surmised that mortgage rates would decline to 3.5% – see 30 Year Fixed Rate of 3.5% Likely.

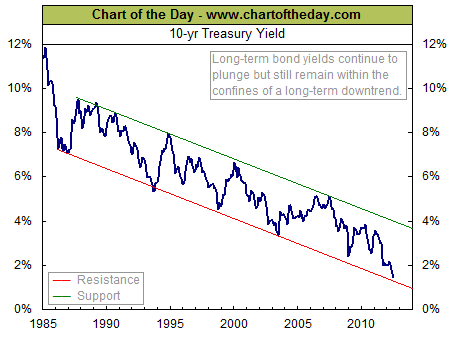
The Chart of the Day has a long term chart of the 10 year treasury and notes that the recent sharp decline in interest rates “has brought the 10-year Treasury bond yield right up against resistance of its 26-year downtrend channel.”


Optimists On Housing Recovery May Have To Wait Another Decade – Humpty Dumpty Vs The Fed

It wasn’t supposed to be like this.

Housing prices were never supposed to decline year over year.

Economic depressions were supposed to be a relic of the past.

If the economy weakened, the Fed would fix everything with lower interest rates and Congress would pass some new laws to create new jobs.

If things got really tough, the government would temporarily increase the debt and the magic of Keynesian economics was supposed to quickly “re-stimulate” the economy.

Our children were expected to lead more prosperous lives.  They were not supposed to move back in with Mom and Dad after four expensive years of college – arriving on the doorstep with a diploma in one hand, student loan notes in the other, telling us that they couldn’t find a job.

Day by day, we are discovering that a lot of things that were never supposed to happen are happening and no one seems able to turn things around.

The Federal Reserve and the White House promised to re-inflate the collapsed humpty dumpty real estate bubble with printed money and bailout programs for banks and defaulted homeowners.

An ex Princeton professor, now Chairman of the Federal Reserve, spent his life studying the Great Depression of the 1930’s.  He was supposed to know how to prevent another one, or so he assured us.

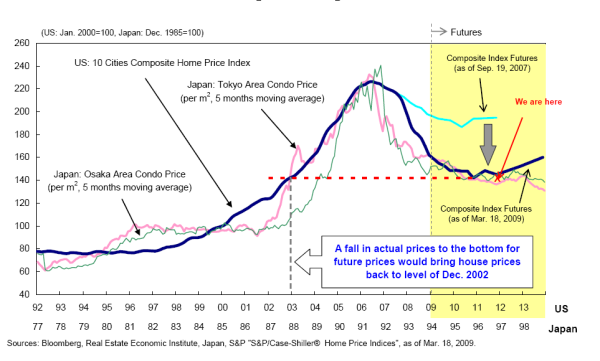
Fast forward to 2022 – housing prices that were supposed to have recovered a decade ago are still at levels seen more than 20 years ago.

Not possible you say?  Optimists and shills for the housing industry might want to consider some inconvenient truths.

Will the U.S. have 20 years of stagnant home prices?

What if real estate prices remain the same for another decade?  As I look at economic trends in our nation including the jobs we are adding, it is becoming more apparent that we may be entering a time when low wage jobs dominate and home prices remain sluggish for a decade moving forward.  Why would this occur?  No one has a crystal ball but looking at the Federal Reserve’s quantitative easing program, growth of lower paying jobs, baby boomers retiring, and the massive amount of excess housing inventory we start to see why Japan’s post-bubble real estate market is very likely to occur in the United States.  It is probably useful to mention that the Case-Shiller 20 City Index has already hit the rewind button to 2003 and many metro areas have already surpassed the lost decade mark in prices.  This is the aftermath of a bubble.  Prices cannot go back to previous peaks because those summits never reflected an economic reality that was sustainable.

Courtesy: doctorhousingbubble.com

The days of “no doc” loans are long gone and not likely to return anytime soon.  Lenders have reactivated a quaint old mainstay of mortgage underwriting and now require borrowers to verify the capacity to service debt payments.  Higher home prices require rising incomes but real incomes for many Americans have been declining for decades.

The income of the typical American family—long the envy of much of the world—has dropped for the third year in a row and is now roughly where it was in 1996 when adjusted for inflation.

The income of a household considered to be at the statistical middle fell 2.3% to an inflation-adjusted $49,445 in 2010, which is 7.1% below its 1999 peak, the Census Bureau said.

The Census Bureau’s annual snapshot of living standards offered a new set of statistics to show how devastating the recession was and how disappointing the recovery has been. For a huge swath of American families, the gains of the boom of the 2000s have been wiped out.

Earnings of the typical man who works full-time year round fell, and are lower—adjusted for inflation—than in 1978.

Gary Shilling, who correctly called the housing bubble collapse, tells the Wall Street Journal that housing prices could decline another  20% or more.

It will take a 22% drop to return median single-family house prices to the trend identified by Robert Shiller of Yale University that stretches back to the 1890s and prevailed until the housing bubble began. (It adjusts for inflation and the tendency of houses to get bigger over time.) And corrections usually overshoot on the downside just as bubbles do on the upside.

The problem is excess inventories. They are the mortal enemy of prices, and we’ve calculated an excess of two million housing units, over and above normal working levels of inventories of new and existing homes. That is huge, considering that before the housing market collapsed, about 1.5 million new homes were being built annually, a figure that shrank to 568,000 in February. At current rates of housing starts and household formation, it will take four years to work off the excess inventory, plenty of time for those surplus houses to drag down prices.

Additionally, our inventory estimate doesn’t even include future foreclosures, some five million of which are waiting in the wings. The 49% drop in new foreclosures since the second quarter of 2009 is a mirage, and was partly due to the Obama administration pressuring mortgage lenders to try to modify troubled mortgages to keep people in their homes. (They were largely unsuccessful.)

We can say that “We are not Japan” but every passing day proves otherwise.  And for those misguided souls who still believe that the government and Fed can put humpty dumpty back together again, don’t you think that if they could have they would have?

Why Amazon Gained 380% And Hewlett-Packard Lost 42% In The Past Five Years

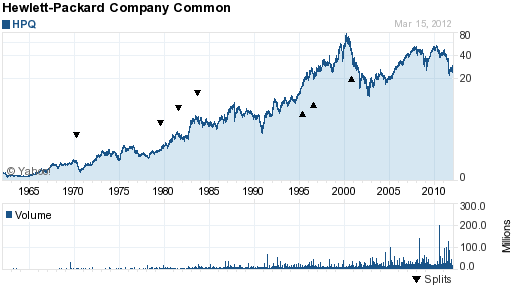
Hewlett-Packard Company (HPQ), one of the greatest success stories of American enterprise, seems to have lost its magic.  Superb management and great products resulted in HPQ’s stock rising relentlessly from the mid 1960’s through early 2000 when the stock traded in the $70 range.  After 12 long years, HPQ’s stock trades for a third of its value, closing today at $23.46.

HPQ - courtesy yahoo.com

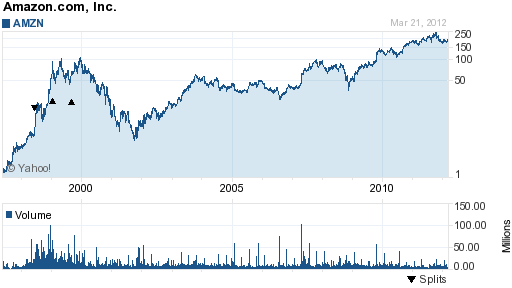
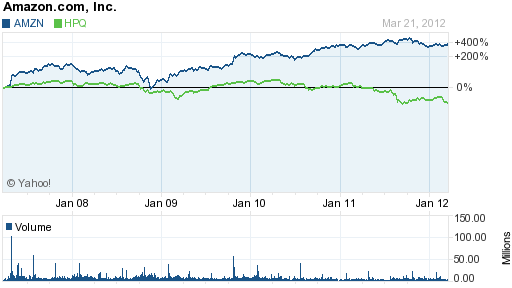
Meanwhile, Amazon (AMZN), under the brilliant leadership of Jeffrey Bezos, has seen its stock price almost double since 2000.  Over the past five years, Amazon’s stock price has risen by 380% while Hewlett-Packard’s has declined by 42%.

AMZN - courtesy yahoo.com

The rise of Amazon and the fall of Hewlett-Packard involve many complex factors, but one critical area where Amazon absolutely scorches Hewlett-Packard is in customer fulfillment, an essential aspect of e-commerce.

AMZN VS HPQ - COURTESY YAHOO.COM

Two years ago I purchased a Hewlett-Packard laptop on which the battery suddenly went dead.  How hard can it be to order a replacement battery for a HP computer from the HP website?  Harder than you can imagine. Here are the results after typing in the information on my computer into the HP search box.

Search HP

for products, services, drivers, support, news and information
No results found for battery for model dv4-2145dx. Please try again.
No results found for replacement battery for model dv4-2145dx. Please try again.

Numerous other queries brought up useless information and links to unrelated topics.  Should it be that difficult and annoying to purchase a replacement battery for an HP computer from the HP website?

On the Amazon website, the query “replacement battery for model dv4-2145dx” instantly  brought up 2 pages of results for the exact item I needed.  Ordering the product took less than 60 seconds and a scheduled delivery time of two days.

What Financial Issues Do People Worry The Most About?

Besieged by the rising cost of energy and food, many consumers are barely able to make ends meet.  Throw in the fact that for many consumers real wages have been stagnant for decades and you have the makings for the establishment of a permanent financial underclass that is living on the edge of financial disaster.

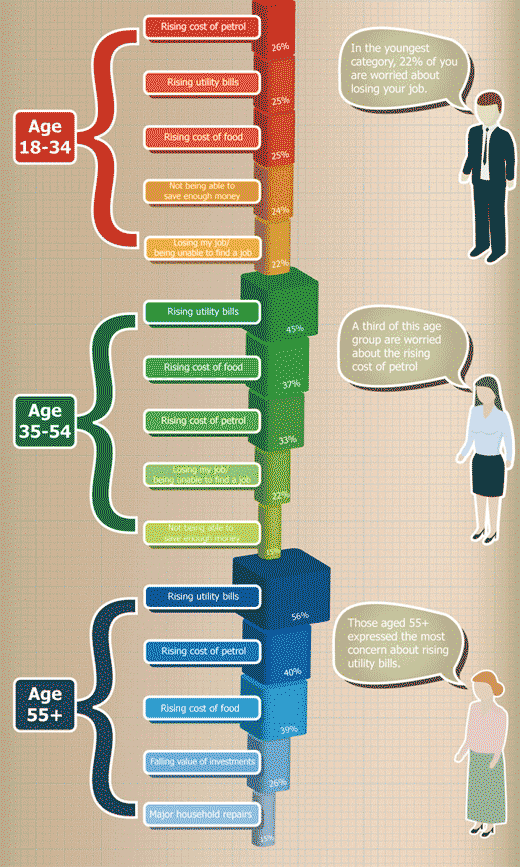
According to a survey of 2,016 Great Britain consumers done by MoneySupermarket, the financial worries most on the minds of people is the rising cost of fuel and food.  Portraying the deep financial distress of the average consumer, only 9% of survey respondents said that they foresaw no financial worries in the next year.

The survey also showed that 8% of people had no one to turn to for help if a financial emergency arose.

The infographic shown below breaks out the financial worries of the survey respondents by age group.  It is interesting to note the older respondents had the greatest worries about the cost of fuel, utility bills and food costs, suggesting that the older age groups have less disposable income and/or are worried about having enough money for retirement.

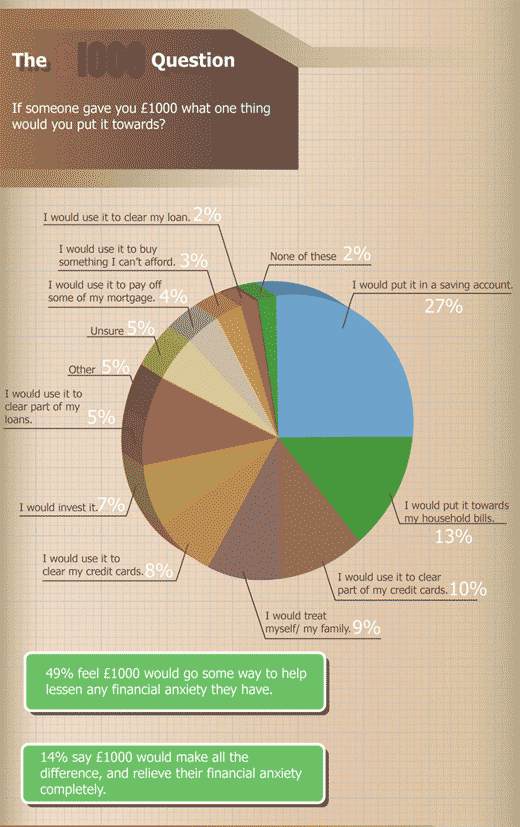
The precarious financial condition of  many individuals in the survey is highlighted by the impact that a relatively small amount of money would have on their financial situation.  Shown below are the survey results to the question of what respondents would do if they suddenly received 1,000 British pounds, the equivalent of US $1,584.  Almost 50% of respondents replied that a 1,000 pound windfall would help to relieve their financial anxiety.

Although the survey does not directly inquire as to what amount of financial assets the respondents had, it appears somewhat obvious from the survey answers that most had very little or no savings on which to fall back on.  Nor does the survey report on what is the biggest problem confronting virtually every developed country in the world – the crushing level of debt burdens on consumers and governments.

Central banks have probably prevented a 1930’s style deflationary depression by printing trillions in paper currency to support over-leveraged banks, consumers and governments.  Unfortunately, Central Banks cannot manufacture what is most needed in weak economies which is  jobs and higher incomes.