January 21, 2025

What Dow Stock Is Up the Most in 2013 With a 74% Gain?

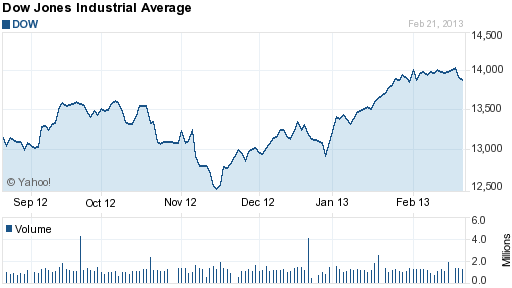
The Dow Jones Industrial Average is up a stunning 18.8% this year as of Friday’s closing price of 15,570.28.

While an investor in the Dow 30 stocks has done quite well this year, the S&P 500 has outperformed the Dow Jones this year by about 5%.  After closely tracking the returns of the Dow for most of 2013, the S&P has broken out to new highs while the Dow has basically been churning in a trading range between 15,000 and 15,500.

Is there any significance to the sudden under performance of the Dow Jones to the S&P or is it impractical to compare the prices of a small sample of 30 stocks to 500 stocks?

Courtesy: Yahoo Finance

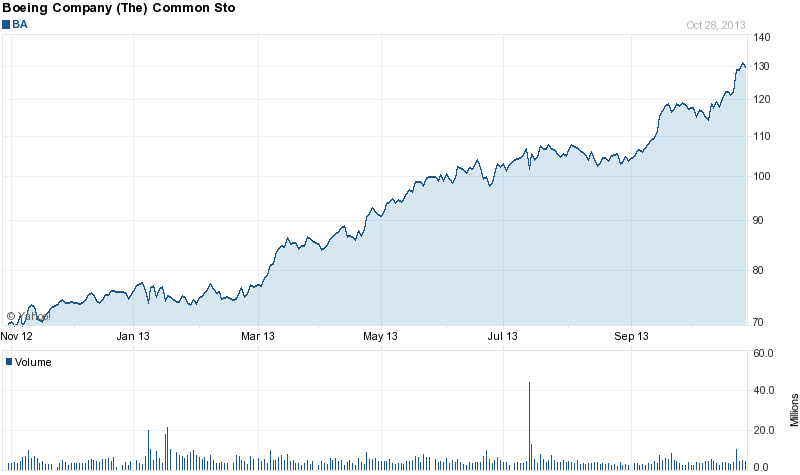
Had it not been for the unbelievable gain in Boeing this year, the S&P and Dow Jones would have had an even larger divergence.

Despite the ongoing problems with the 787 Dreamliner, Boeing’s stock price has gained steadily throughout the year and is currently the best performing Dow stock of 2013 with a 74% return.

Courtesy Yahoo Finance

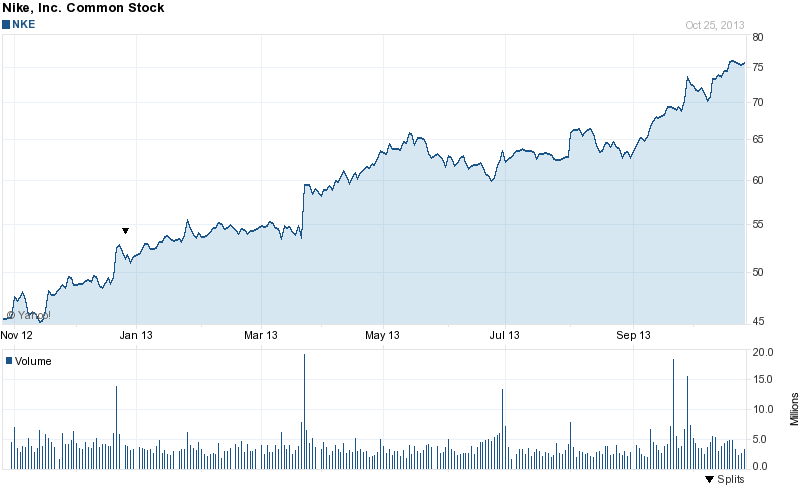
Trailing Boeing for second place in the Dow’s biggest gainers is Nike with a return of 46.7% to date.    Nike is a newcomer to the Dow Jones, having been added in September of this year.

Courtesy: Yahoo Finance

Disclosure: No holdings in either Boeing or Nike.

Google Chromecast Is 2013’s Smash Hit Electronic Wonder


Google has done it again with the release of the Google Chromecast streaming media player.

It wasn’t enough that Google (GOOG) developed and offered for free the Android operating system.  As an open source OS, Android quickly became the world’s most widely used smartphone platform.  Due to its low cost and flexibility, Android is also becoming the software of choice for a wide range of other electronic devices including televisions, video games and digital cameras.   

Google has quietly been coming out with a string of ingenious devices which will bring fundamental changes to the economy and revolutionize the way we live.  Who would have thought that Google would make a self-driving car a reality so quickly or allow us to merge our lives with the internet with Google Glass?

Although the Chromecast  HDMI streaming media player does not seem like that big of a deal compared to other ingenious Google products, it threatens to fundamentally change the multi-billion dollar cable industry, perhaps in the same dramatic fashion that Apple’s IPod changed the music industry.  As media inexorably moves to the internet, who needs the expensive and clunky cable companies with their hideous black cords running all over the house when you can wirelessly connect your TV to the internet with Chromecast?  High monthly cable bills could become a thing of the past.

For only $35 dollars and two minutes of installation time, Chromecast  uses your smartphone, laptop or tablet to stream pretty much anything  you want from the internet to your TV.  As word of Chromecast spreads, it has quickly sold out at major retailers such as Best Buy and Amazon. 

If you use Netflix (NFLX) or want to sign up for Netflix the Chromecast is essentially a free giveaway to consumers since existing or new Netflix customers will receive three months of free service which is worth about $35.

Google is quietly establishing itself as one of the most innovative companies in the world.  It’s hammer lock on internet searches provides billions of dollars in profits that are being used to develop new products and technologies which in turn provide Google with massive amounts of information on consumer preferences and buying habits.  The massive data bases gathered on consumers using Google products in turn allows Google to charge advertisers higher ad prices through focused marketing and the profitable circle is completed.  If anyone is looking for the first trillion dollar market cap stock, Google is a prime candidate.

Jones Soda – Back from the Dead

About a decade ago, Jones Soda (JSDA) was briefly an incredible success story about a regionally popular brand which had used grassroots marketing to achieve rapid growth on a national scale. Unfortunately, the soda story fizzled when they tried to expand into national chains like Target (TGT) and Walmart (WMT) using aluminum cans rather than their iconic glass bottles.  In addition, Jones Soda began their expansion efforts precisely at a time when the popularity of carbonated beverages began to decline.

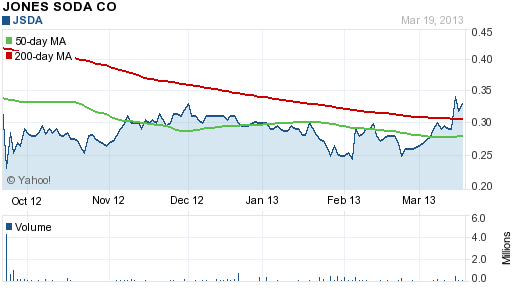
A combination of missteps and bad timing brought the company to the brink of bankruptcy, driving its once promising stock from a peak of more than $28 to less than $1. The price fell further to about 25 cents after the shares were delisted from the NASDAQ exchange.  Since early March Jones Soda has been moving steadily higher and recently had a higher volume spike that propelled the stock price above both the 6 month price range and the 50 and 200 day moving average.

courtesy: yahoo finance


Courtesy: yahoo finance

Things may finally be looking brighter for Jones Soda with new CEO Jennifer Cue at the helm. Since her appointment on June 30, 2012, she has implemented a back to basics turnaround strategy which has allowed the company to stabilize before pursuing a path of responsible and hopefully profitable growth.

The strategy involved rapidly trimming expenses and slightly retrenching to the company’s core markets and independent distributors. In the latest quarter, operating expenses were cut to $1.1 million compared to $2.7 million last year. Some of the cuts did have an impact on revenue which fell to $3.1 million from $3.4 million in the prior year. Despite the drop in revenue, gross profit was up slightly, showing the positive impact of the realignment of costs.

The loss from operations for the most recent quarter was $448,000, a vast improvement from the loss of $2.0 million last year. Most significantly, the company was cash flow positive for the quarter with $247,000 generated from operations. In the previous three quarters, Jones Soda had negative cash flow from operations of $6.5 million, and they were at risk of running out of capital. Now the company believes they have sufficient working capital to carry out their operating plan for 2013.  In addition to $4.1 million of working capital, Jones Soda has a $2 million credit facility.

Corporate insiders have confirmed their conviction of a brighter future for Jones Soda through a series of stock purchases.  CEO Jennifer Cue bought 50,000 shares at $0.30 from December 7 to 10, 2012.  Carrie Traner, VP of Finance bought 10,000 shares at $0.29 to $0.34 on March 14 – 15, 2013 and Director Mills A Brown bought (indirectly) 81,350 shares at $0.2975 to $.033 on March 15, 2013.

Now that the company has brought expenses under control, they are investing in distribution and product lines that will drive long term profitable growth. After laying off nearly half of their staff in the second half of 2012, they recently hired four new employees for their sales staff. The sales staff is now paid on a variable compensation structure, which should help to keep costs aligned with revenue.

The company has just introduced Jones Natural, which will soon launch in California. The new beverage has 30 calories and will come in four different flavors. It will be offered in 50 Albertson’s grocery stores in the natural foods section. The new beverage will also be offered in 25 Whole Foods Market (WFM) stores in Northern California. Significantly, this is the first time that a Jones Soda product has been carried by Whole Foods.

The groundwork has now been laid for a possible return to growth and profitability for a company once left for dead. The current market cap of merely $13 million hardly reflects the progress that has been made in the last two quarters.  While the stock remains extremely speculative, it is certainly one worth watching in the coming months.

Disclosure: Long JSDA

SELL EVERYTHING NOW! – How To Avoid Idiots Masquerading As Financial Experts

From mid November 2012 to February 19th, 2013, the Dow Jones Industrial average gained 1,400 points for a gain of almost 12%.  On February 20 and 21, the Dow Jones swooned a quick 200 points, a loss of less that 2%.  Such a minor pullback after a robust multi month rally is not what I would consider to be a shocking or unexpected event.

Nonetheless, innumerable articles predicting financial Armageddon have appeared in the mainstream financial press following the market’s minor correction.  Has the world really changed all that much after a 200 point Dow loss or is there something fundamentally flawed with the manner in which the financial press presents information to its readers?

News organizations have the right to publish whatever they chose to.  The question that needs to be asked by the investing public is whose interests are best being served.  Do sensationalistic headlines really translate into useful information for readers or is the mainstream press primarily serving its own financial interests by publishing hyped up “news” to boost advertising revenue?  Caveat emptor – financial readers need to identify and ignore trash journalism.

Here’s the example of the week on the type of “trash reporting” that investors need to ignore.  So called “market guru” Dennis Gartman tells his subscribers that he is selling and “rushing to the sidelines.”  CNBC regularly interviews Gartman who always comes up with wonderful soundbites that help CNBC (whose ratings have plunged).  Gartman also benefits by plugging his market newsletter.  No problem so far, but does the declining audience of CNBC benefit, most of whom presumably tune in for intelligent investment advice?

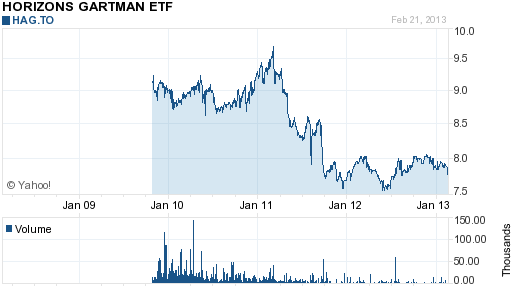
In Gartman’s case, it’s easy to determine the value of his investment prowess since Mr. Gartman runs his own little alternative investment fund known as Horizons Gartman ETF Comm (HAG.TO).  According to Yahoo, “The fund’s objective is to provide investors with the opportunity for capital appreciation through exposure to the investment strategies of The Gartman Letter, L.C., founded by Dennis Gartman.”  So how has that worked out?

The horrendous return on this fund becomes even more disconcerting when considering that the overall market is up around 100% since Mr. Gartman started the fund in late 2009, shortly after the bottom of the last bear market.  When CNBC features Mr. Gartman as an investment expert without noting his abysmal investment track record, they are engaging in the worst form of deception.  If CNBC ever wants to be taken seriously and increase its viewership level, they should start by removing idiots like Gartman from their interview list.

Barron’s Super Bullish Cover Story – Don’t Waste Your Time Worrying About It

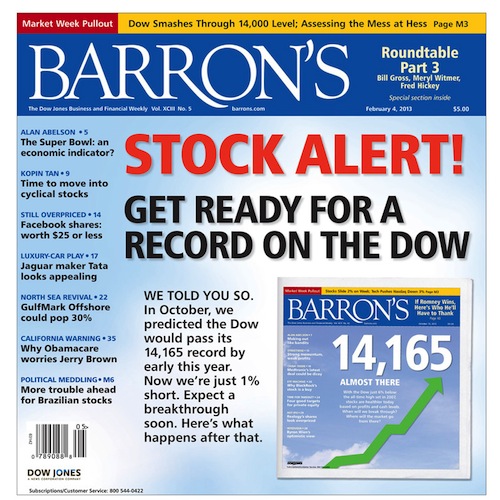
Barron’s super bullish cover story this weekend raised some eyebrows in the investment world.  According to popular legend, mass market magazines in the past have had a tendency to feature investment areas right at their peaks.  The alleged power of cover stories to signal tops in markets has even resulted in the “magazine cover indicator.”

Perhaps the most famous example of the “magazine cover indicator” was Business Week’s “Death of Equities” cover story in 1979 just prior to the beginning of the biggest and longest bull market in history.  The theory is that by the time a trend makes it to the front pages, the smart money has already gotten in and there is little to be gained by following the herd at that point.  Life is not that simple, however, and the “magazine cover indicator” doesn’t always work.  After making a really bad call on stocks in 1979, Business Week warned investors in January 2008 that the worst was yet to come for housing with the cover story “Meltdown – For Housing the Worst Is Yet To Come.”

So what is an investor supposed to think of Barron’s super bullish cover story on stocks?

Josh Brown of the Reformed Broker notes that Barron’s has frequently been right with it’s cover stories and that knee jerk reactions by websites trying to hype the story to increase clicks wind up doing their readers more harm than good.  Hard to argue with Brown’s common sense and balanced advice:

Welcome to the stock market circa 2013, where everyone is a contrarian mastermind and every piece of optimism is an automatic sell signal.

Everyone’s soooo clever with their magazine cover indicators. They saw the Barron’s cover from this Saturday and couldn’t wait to mock it, it’s almost like a reflex at this point. Anyway, here’s the “Kiss of Death” everyone’s carrying on about this weekend:

So here’s the deal, maybe this is the market top. Maybe we don’t quite make that new high above 14,165 on the Dow or worse – maybe we hit it and then crater. Who knows?

But I do know this…if it falls apart, it will have nothing to do with a Barron’s cover. After all, how would you have liked being short any of the below?

How about fading that 9/3/2012 cover below with the Bull bouncing a cannonball off his chest, everyone thought that one was laughably bullish…what are we up, 20% plus from there? More?

Or what about the now-infamous “Bye Bye Bear” cover from November 2010, how’d the other side of that trade work out for you?

Or what about the Buy Goldman cover from last October? That was  hilarious too, hope you didn’t automatically bet against it!

Or how about the “Time To Buy” Banks cover from the end of 2011? Seemed ridiculous with BofA and Morgan Stanley moments from succumbing to mortgage litigation and Euro exposure. God help you if you shorted that cover, most of the large cap banks mentioned went on to double over the next year while the sector itself went on to beat every other in the S&P with a 27% gain. They’d be scraping your too-clever ass off the sidewalk right about now.

At the other extreme, we get the hysterical conclusion from Global Economic Analysis that Barron’s has managed to mark the exact top of the bull market.  After some snarky commentary on Barron’s “faulty” use of the term money flow in explaining how investors are moving from bonds to stocks, the conclusion is made that it’s time to ditch stocks.

Third let me ask “Does it get any more extreme than someone calling this the first inning after stocks have had more than a 100% rally in a few years?

Supposedly we are only in “the first inning” of a rally. Hmm. Are stocks supposed to rise 900% more? This may not be “the top” but it’s close enough for me. I’m calling it.

So there you have it – this is a market top or maybe it’s not a market top.  The only conclusion one should draw from this is that anyone making investment decisions based on magazine covers should not be investing and deserves to lose money.  Instead of worrying about magazine covers, a sophisticated long term investor would be much better off reading the annual letter to shareholders from Warren Buffett.

Dogs Of The Dow Outperform In 2011

Sometimes, the simplest investment strategy is the best.

The simple “Dogs of the Dow” investment strategy mechanically selects the 10 highest yielding Dow stocks at the end of each year.  The selection is made without regard to fundamental analysis of dividend sustainability or financial strength.  Investment dollars are equally allocated, resulting in an equal dollar investment in each of the 10 Dogs of the Dow.

The “Dogs of the Dow” investment strategy was popularized in 1991 by Michael O’Higgins in his best selling book, Beating the Dow.  Due to the popularity of the book, Mr. O’Higgins was credited by the news media with “inventing” the Dogs of the Dow.  The average investor found the “Dogs of the Dow” strategy compelling based on its simplicity and superior investment results.  According to Mr. O’Higgins, the average annual returns over a 17 year period for the Dogs of the Dow was 17.9% compared to a return of only 11.1% for investing in the entire 30 Dow stocks.

There is an intuitive appeal for the Dogs of the Dow strategy.  Dow stocks are usually large blue chip companies that have withstood the test of time.  Occasionally, even the best run companies with superior management and products can encounter problems that result in a declining stock price.  Assuming that the company has the financial strength to maintain its dividend, buying the highest yielding Dow stocks puts an investor into the companies most likely to experience large price gains as business conditions improve.

There is no such thing as a perfect investment strategy.  The Dogs of the Dow can produce years of sub par returns.  For example, during the three year period from 2007 through 2009, the Dogs of the Dow underperformed the Dow Jones by 7.8%, 8.1% and 5.9%, respectively.  As previously mentioned, the Dogs of the Dow strategy does not analyze the financial strength of the various Dow stocks.  Most of the under performance of the Dogs from 2007 to 2009 was due to the the collapse of financial stocks in the Dow Jones, including Citigroup (C), Bank of America (BAC) and JP Morgan Chase (JPM).

In 2010, the Dogs of the Dow had a total return including dividends of 21% versus a return of 14% for the entire Dow 30 stocks.  This out performance in 2010 almost exactly matches the 6.8% superior return for the Dogs of the Dow cited in Michael O’Higgins book Beating the Dow.

The investment performance of the Dogs of the Dow through September 30, 2011 indicates that the Dogs may again outperform the overall Dow in 2011. As of September 30, 2011, the Dow Jones was down by 5.72% or -644 points while the Dogs of the Dow were down a mere 1.4%.  In addition, the nine month return from dividends on the Dogs of the Dow stocks amounted to 3.15%, resulting in an overall gain of 1.75%.  During a time of zero returns on bank savings and, considering the huge overall sell off in the markets since July, the Dogs put in a respectable showing.

DOW JONES - COURTESY YAHOO FINANCE

The chart below shows the 2011 results for the Dogs of the Dow through September 30.  The largest loser was Dupont which lost 19.9% and the largest gainer was McDonalds which was up 14.4%.  The current highest yielding stock is AT&T (T) at 6% and the lowest yielding stock is McDonalds (MCD) at 3.2%.

DOW DOG STOCK $PRICE 2010 $PRICE $DIVIDEND* DIVIDEND % YTD
YEAR END 30-Sep-11 YIELD CHANGE
ATT 29.38 28.52 1.72 6.00% -2.9
VERIZON 35.78 36.80 2.00 5.40% 2.8
MERCK 36.04 32.70 1.52 4.64% -9.3
PFIZER 17.51 17.68 0.80 4.50% 0.9
DUPONT 49.88 39.97 1.64 4.10% -19.9
INTEL 21.03 21.34 0.84 3.90% 1.5
JOHNSON & JOHNSON 61.85 63.69 2.28 3.60% 3.0
KRAFT FOODS 31.51 33.58 1.16 3.50% 6.6
CHEVRON 91.25 92.59 3.12 3.40% 1.5
MCDONALDS 76.76 87.82 2.80 3.20% 14.4
* FORWARD ANNUAL DIVIDEND Data Source: Yahoo finance

Over the long term, the Dogs of the Dow have delivered documented superior returns.

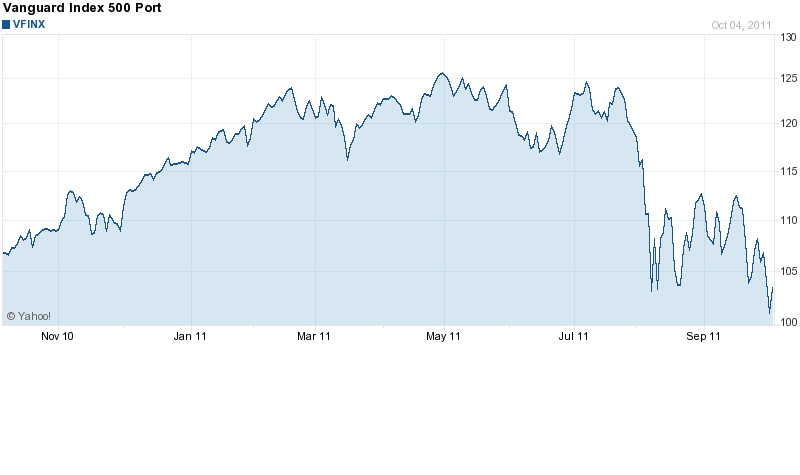
One argument against the Dogs of the Dow strategy is that the portfolio lacks diversification and is therefore riskier.  For example, many analysts recommend investing in a broadly diversified mutual fund such as the Vanguard 500 Index Fund which invests equally in the 500 different stocks in the Standard and Poors 500 index.  How did that work out this year?

Dogs of the Dow followers, with their small 10 stock portfolio, are laughing all the way to the bank.  The Vanguard S&P 500 Index fund (VFINX) is down a whopping 8.8% (including dividends) through September 30, 2011.

Disclosures: Positions held in CVX, PFE, JNJ, T, VZ

Cramer VS Roubini – Nasty

deal

Round One?

Things got real nasty as two giants in the world of financial commentary engaged in a bare knuckles brawl.  Nouriel Roubini earned his reputation by being one of the few to correctly predict the ongoing economic crash and he remains stoutly bearish.  Jim Cramer has repeatedly called bottoms as the Dow cratered from 14,000 to 6,500 and has endured continual sniping from critics who have documented his inaccurate predictions.

Roubini is seen by many as a perma bear while Cramer could be called a perma bull.   Comedian Jon Stewart didn’t get much of an argument from Cramer when he accused Cramer of missing the signs of a “once in a lifetime financial tsunami”.

The true test of greatness going forward will be decided by who correctly calls the bottom to this depression/recession.   The bets have been placed – time will tell who is right.   In the meantime, it was certainly better to take Roubini’s advice for the past three years.   Those market investors who ignored the bearish calls of Roubini have taken a major hit to their net worth.

The entertaining remarks made by each gentleman about the other follow, courtesy of guardian.co.uk.

Roubini, a New York University professor who famously forecast a dire world recession as far back as 2006, has taken exception to remarks on a blog by Cramer that he is “intoxicated” with his own “prescience and vision” and is refusing to see green shoots of recovery in the financial markets.

“Cramer is a buffoon,” said Roubini. “He was one of those who called six times in a row for this bear market rally to be a bull market rally and he got it wrong.”

Roubini, who believes the situation is so gloomy that leading US banks may need to be nationalised, was dismissive of Cramer: “After all this mess and Jon Stewart, he should just shut up because he has no shame.”

Speaking to the Associated Press ahead of a speaking engagement in Toronto, the economist continued: “He’s not a credible analyst. Every time it was a bear market rally he said it was the beginning of a bull, and he got it wrong.”

Last week, Cramer told his viewers that the recent 20% rally in Wall Street markets was sufficient to judge that the downturn was past its worst: “Right now, right here, on this show – I am announcing the depression [is] over!”

Depression Over?

Let’s hope that Cramer gets one right this time with his prediction that the “depression is over”.

The Dow Jones Is Really At 1,000

Larry Summers Says Buy Stocks

The President’s economic advisor, Larry Summers, noted last week that:

“Although there could be many ways to question this calculation, that the market would be at essentially the same real level as it was in 1966 when there were no PCs, no Internet, no flexible manufacturing, no software industry and when the work force was half and net capital stock was a third of what it is today, may be regarded by some as the sale of the century.”

Observations

This implies that the dollar is worth is worth less than 1/7th of what it was worth in 1966.

This calculation does not take into account the dividend stream from owning the Dow Jones stocks.

Per Mr Summers calculations, stocks have gained zero for the past 43 years after adjusting for inflation.

There is something fundamentally wrong with the American economy when the value of America’s Dow 30 stocks do not increase in real value over 43 years.

It is very difficult to increase your wealth by investing in the stock market.

The buy and hold theory for stocks may help brokers sell stocks, but for the long term investor it is a cruel hoax.

If you bought the Dow Jones in 1966 at 1,000 and sold today at 7,000 you would be in a loss position on your inflation adjusted capital, after paying capital gains taxes.

Buying stocks has returned a zero gain for the past 43 years but Mr Summers says that stocks are now the buy of the century.  Does this make him an idiot or a genius?

Mr Summers should focus on ways to create real wealth and jobs in America that are not dependent on excessive leverage.   We tried to get rich with borrowed money and easy credit and it obviously did not work for the majority of Americans.  Instead of pursuing that same losing strategy, maybe it’s time for a new approach.

Stay Long SSO & DIA

My initial assessment on December 3rd that the world had run of sellers has been a win so far – see Breathless Hysteria Overdone?

I am maintaining my long positions in SSO and DIA.

Although not quite as bullish as I was a month ago, my thoughts remain the same:

Markets discount bad news and this market has discounted everything except the end of civilization.  The talking head predictions of doom dominate the headlines.   Today is probably psychologically equivalent  to when oil was peaking at $150 and predictions of $300 dominated the headlines.

Without bothering to consider what the future will bring, at this point there is money to be made on the long side.   The market is extremely oversold.  Nothing goes in a straight line.  High quality Dow stocks have 5-7% dividends.  The Fed’s zero interest rate policy will force money into higher risk investments.  There is optimism building about a new Administration.

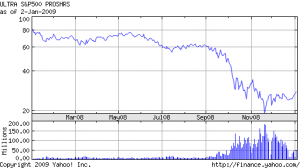
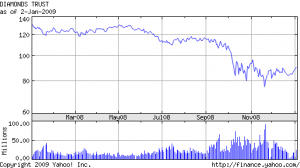
Returns on SSO and DIA from December 3, 2008 closing to January 2, 2009 closing.

It is interesting to note that the DIA, an ETF structured to provide investment results that, before expenses, match the price and yield of the Dow Jones Industrial Average returned 4.8% vs 5.1% for the DJIA.

The SSO, an ETF designed to return twice the performance of the S&P 500, returned 12.3% vs a gain of 7.0% on the S&P500.

Generally speaking, the ETF’s worked as they were theoretically supposed to.

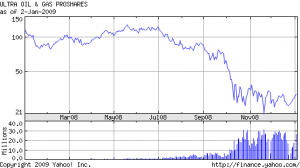
Under my theory of selective contrarian investing, which has served me well, this may be the time to start moving into selective issues in the oil and gas industries and to start selling positions in long treasuries.   Given the vast over performance of treasuries last year and the dismal results in oil and gas, the odds favor this investment reallocation on a long term basis.

I will be buying DIG this week and adding to positions on weakness.

Let’s all have a prosperous New Year!

Charts courtesy of Yahoo Finance